
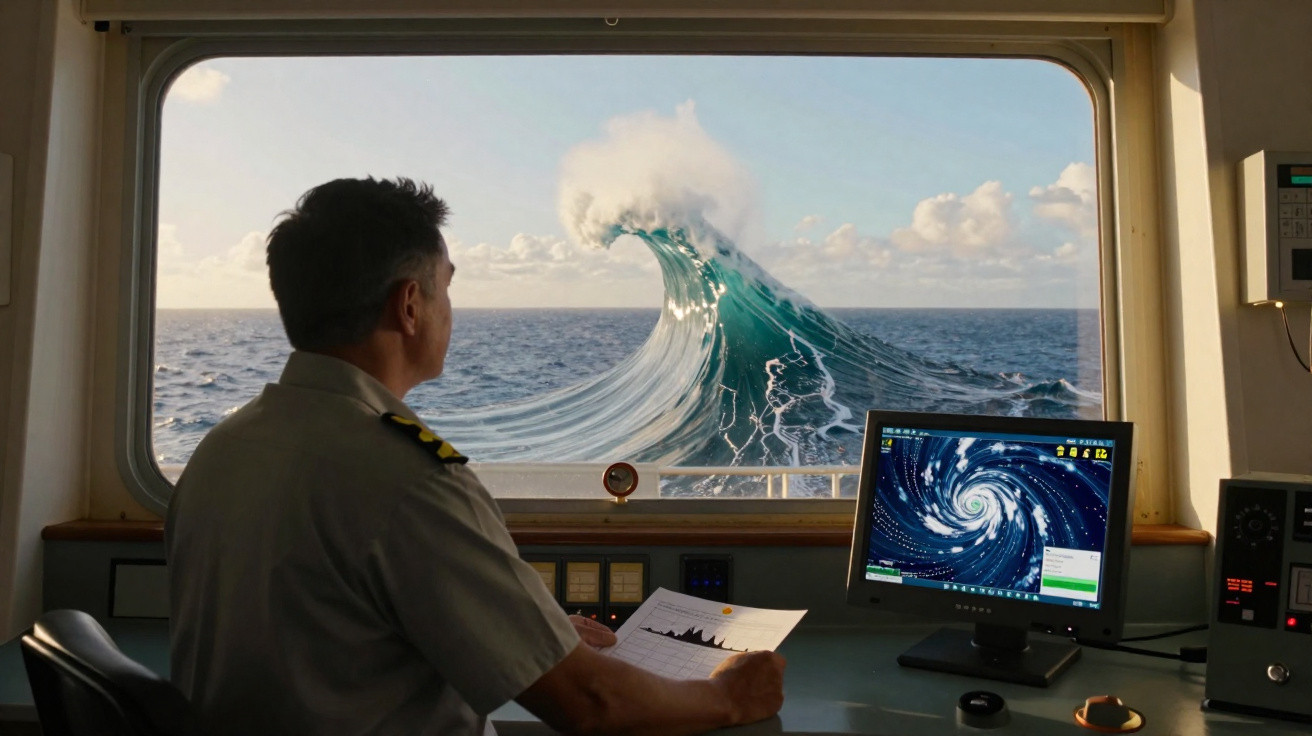
Far out in the Pacific, satellites have detected a disturbing sight emerging from the water: waves as high as a ten-storey building.
Reaching roughly 35 metres, these immense walls of water are prompting scientists to consider whether the climate system is merely displaying its natural strength or whether they signal the opening stages of a more chaotic ocean future.
Monster waves where ships least want to see them
Wave heights in the open Pacific do not normally make headlines. Shipping routes are altered, surfers follow swells, and climate models process data quietly in the background. Yet satellite altimeters have recorded a group of extreme waves that challenge the upper boundary many oceanographers anticipated in this region.
These are not the attractive breaking waves pictured in holiday advertising. A 35-metre wave is a moving cliff of seawater. It can rip containers from cargo vessels, harm offshore platforms and swamp a ship struck from the side.
Satellites circling hundreds of kilometres above Earth are now picking up ocean events that once went almost entirely unseen.
In recent years, several satellite missions have been steadily charting the Pacific surface and measuring minute changes in sea level. Scientists can use those measurements to recreate wave patterns, including unusual giants that might otherwise leave evidence only in the form of rattled crews and damaged hulls.
Natural variability or early climate chaos?
At the centre of the scientific debate is an apparently straightforward issue: are these waves extraordinary accidents, or do they belong to an emerging trend?
Many scientists emphasise that climate systems have always generated extremes. The Pacific is enormous, wind patterns vary annually, and uncommon combinations of storms and swells can create one-in-a-thousand-year waves even when the climate is stable.
Other researchers identify a more worrying possibility: that climate change is already altering the statistical profile of ocean risk.
One camp calls the waves a painful reminder of natural variability, the other sees them as early alarms from a warming ocean–atmosphere system.
In a stable climate, models set an expected upper threshold for wave size under particular wind and storm conditions. If observations repeatedly exceed that range, scientists begin to wonder whether the range itself is shifting.
How warming air can build taller seas
Climate physics provides a clear explanation. Warmer air retains more moisture and contains more energy. Storms driven by such air are often stronger and can remain over the same expanse of ocean for longer.
More powerful, longer-lasting winds transfer additional energy to the sea surface. Across hundreds of kilometres, that energy develops into bigger and more forceful waves.
- Warmer oceans provide extra fuel for storms and tropical cyclones.
- More intense storms produce longer fetches – the distance wind travels across water.
- Greater wind speeds and longer fetches generate taller, more energetic waves.
- Ocean currents may then concentrate that energy into localised monster waves.
Not all storms will generate a record-breaking wave. However, a change in the underlying climate can increase the base risk of extreme events, making these monsters marginally more frequent than historical statistics indicate.
Satellites versus buoys: why this matters now
Traditionally, records of ocean waves have relied on buoys, ship logs and a limited number of coastal instruments. Such records contain major gaps. Cargo captains do not always document frightening nights at sea, while buoys can fail, drift away or simply be absent from the places where the largest waves occur.
Satellite monitoring changes that situation. Radar altimeters measure sea-surface height with great accuracy along narrow paths. Gathered across months and years, these paths create a detailed picture of wave conditions throughout the Pacific.
For the first time, scientists can watch the most remote parts of the ocean with something close to continuous, impartial surveillance.
This increased visibility has two implications. We are at last detecting extremes that likely happened previously but were never recorded. It also allows scientists to investigate whether such extremes are accelerating, appearing in clusters or becoming more intense than historic climate records would imply.
What the data is hinting at
Early assessments of satellite data indicate a slight upward movement in significant wave height – a standard measurement based on the highest third of waves within a particular area. The rise is uneven. Some Pacific regions show minimal change, whereas storm tracks in the Southern Ocean and North Pacific reveal stronger signs.
The notable 35-metre events lie at the far extreme of this distribution. One or two could be treated as unlikely flukes. A succession of them, particularly when they coincide with severe storm seasons and unusual wind patterns, poses further questions.
| Feature | Past climate expectation | Recent satellite hints |
|---|---|---|
| Maximum wave height | Rarely above low-30-metre range | Events near or above 35 metres observed |
| Frequency of extremes | Very rare, isolated in time | Clusters in certain storm seasons |
| Regional spread | Confined to known storm belts | Signals extending farther into shipping lanes |
What this means for ships, coasts and insurance
To shipping operators, the distinction between a 25-metre sea and a 35-metre sea is far from theoretical. It separates difficult weather from a test of structural survival.
Modern container ships have become higher and broader in the drive for greater efficiency. Their tall, flat sides behave like sails during powerful winds. When a monster wave strikes, forces on the hull may surpass design assumptions based on older wave statistics.
This threat is already influencing route-planning and insurance models. Insurers examine the same climate information as oceanographers. Should extremes appear more probable along major Pacific corridors, premiums will increase and routes could be changed, adding voyage days and raising the cost of goods.
Coastal communities also experience the consequences. Pacific islands, low-lying atolls and exposed headlands are all influenced by offshore wave climate. Larger, more energetic waves send more force into nearshore waters, worsening erosion, stripping away protective beaches and putting pressure on coral reefs that shield coastlines.
Even when they never break on a beach, far-off giant waves can reshape how energy moves through the ocean toward vulnerable coasts.
Rogue waves and climate: two different problems colliding
A distinct but connected phenomenon can complicate the discussion: rogue waves. A rogue wave is one isolated crest that is far larger than the surrounding sea, caused by the interference of multiple wave trains or by interactions with powerful currents.
They can form almost without warning, including on days when average conditions do not appear especially severe. Climate change does not directly “create” rogue waves, but a more energetic background sea state could marginally increase the likelihood of these rare monsters developing.
Consequently, ships already working close to their design limits in a storm face an added danger from short-lived, unpredictable crests on top of waves that are already enormous.
Why scientists disagree – and why that disagreement matters
Debates over natural variability and climate-driven change do not mean scientists lack understanding. They reflect imperfect, complicated data and a baseline that is changing rapidly.
One camp notes that long-term wave records cover only a few decades at most. In climate terms, that is a brief period. From this viewpoint, making confident judgments from such a limited snapshot risks reading too much into random variation.
Others argue that the option of waiting for complete certainty does not exist. Infrastructure constructed now – ships, ports and offshore wind farms – will remain in service for 30 to 50 years. If extreme-event statistics are already rising gradually, designs based on twentieth-century data could become outdated quickly.
The dispute is less about whether the climate is changing, and more about how quickly that change is rewriting the odds of rare, destructive events.
Behind the academic debate are highly practical decisions: whether design requirements should be increased, where new offshore schemes should be located, and what degree of risk coastal cities will accept as sea levels rise and storms intensify.
Looking ahead: scenarios for the Pacific’s wave future
Climate models are beginning to address these issues directly. Researchers input projected wind and storm conditions into ocean simulations to assess future wave climates under different emissions pathways.
Several broad scenarios are emerging:
- Low-emissions path: Global warming stabilises near 1.5–2°C. Mean Pacific wave heights alter only slightly, although the most extreme events become somewhat more frequent, particularly along established storm tracks.
- High-emissions path: Warming exceeds 3°C by late century. Intense storms move farther into the central Pacific, significant wave heights increase across large regions, and ship and coastal-defence design standards require a major overhaul.
- Regional wild cards: Changes in El Niño and La Niña patterns affect where and when the worst waves occur, shifting certain hotspots nearer to vital shipping routes and coastal megacities.
None of these forecasts is accurate enough to predict a particular 35-metre wave on a particular day. Still, they outline a future where “rare” may no longer carry its previous meaning for the Pacific’s largest seas.
Key terms worth understanding
A number of technical terms arise in this discussion, and they influence how risk is communicated.
- Significant wave height: The average of the highest one-third of waves during a given period. It offers a realistic indication of conditions experienced by a ship, while the largest individual waves may be roughly twice this height.
- Return period: A statistical calculation of how frequently an event of a certain magnitude could happen – such as a “1-in-100-year wave”. Under a changing climate, these return periods may shorten unexpectedly.
- Fetch: The distance wind blows across water. A longer fetch combined with stronger winds generally produces higher waves.
As the Pacific’s satellite-measured giants move through scientific debates and risk models, the difficult question will be when to judge that a genuine pattern has appeared. For a climate optimist who expected the system to allow a lengthy grace period, 35-metre waves on satellite charts are a stark, chilling reminder that the oceans might be reacting more quickly than our institutions.




Comments
No comments yet. Be the first to comment!
Leave a Comment